Europe’s Copernicus programme publishes some of the richest environmental data on the planet. Yet for the people who could put it to work every day (city planners, GIS analysts, local authorities), getting a single temperature or air-quality layer onto a map still means wrestling with APIs, file formats and grids that refuse to line up. GeoBridge is our attempt to make that wrestling match disappear.
The problem we set out to solve
Most GIS professionals live inside desktop tools like QGIS. Part of ECMWF’s data, meanwhile, lives behind the Climate Data Store and the Atmosphere Data Store, spread across 136 datasets from C3S and CAMS each with its own naming conventions, access routes and quirks.
The gap between those two worlds isn’t a lack of data. It’s friction. Which endpoint do I call? Is this dataset available in the fast cloud-optimised format or only through a queued request? Every one of those questions is a reason for someone to give up.
So our goal was settled: let a GIS user ask for the environmental data they need, in plain terms, and have it land in their project correctly, without ever needing to know what happened behind the scenes
What we built
To address the above mentioned challenges we built Geobridge. GeoBridge has three layers that stack on top of each other.
At the foundation is a Python library, published on PyPI as geobridge under an MIT licence. It handles discovery, authentication, extraction, styling and spatial co-registration. Crucially, it makes access decisions for you: around 26 datasets are available through ECMWF’s fast ARCO (Zarr) path, and the library uses it whenever it can, falling back to the asynchronous CDS API for the rest. It also smooths over the fact that the same variable can go by different names depending on where you fetch it.
On top of that sits a semantic layer, which maps plain-language intent (“urban heat island”) onto the right datasets and variables.
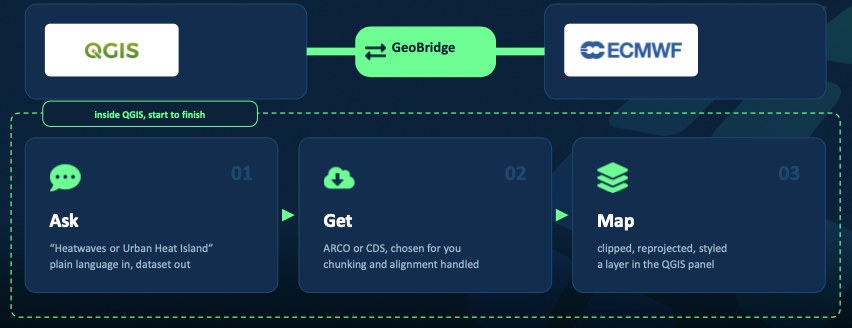
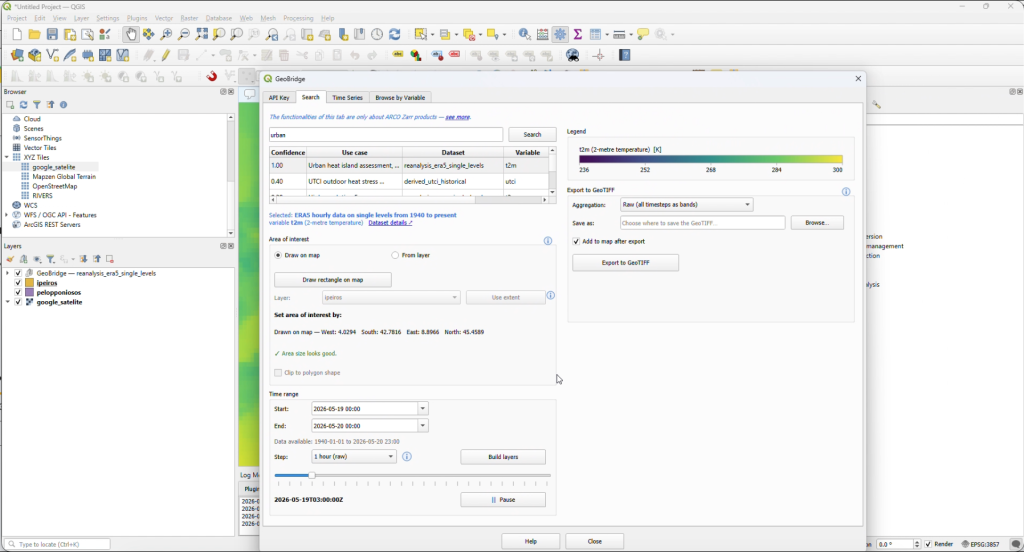
And at the front is a QGIS plugin, now available in the official QGIS plugin repository. This is where most users will meet GeoBridge: browse the catalogue, preview layers as live map tiles, and pull data straight into a project.
What we’d tell next year’s participants
Ship early and in public. Releasing it to PyPI and the QGIS repository forced us to think about real users, not just a demo. Lean on your mentors: Angel Lopez Alos and Samuel Almond at ECMWF repeatedly pointed us towards tools and conventions that saved us weeks. And remember that the “boring” plumbing (environments, encodings, grids) is often where the real value lies, because it’s exactly what stops people from using the data in the first place.
Working in a team also mattered. Splitting the library and the plugin into separate repositories gave each of us clear ownership while keeping the pieces in step.
Takeaway
Open data is only truly open when people can use it in the tools they already know. GeoBridge started as a challenge entry and became a public library and plugin that anyone can install today. Next, we want to connect it more deeply with ECMWF’s earthkit ecosystem and explore extending it to Copernicus Marine data. If you work with maps and have ever thought Copernicus data was too much hassle, give GeoBridge a try and tell us what breaks. That’s how the bridge gets stronger.