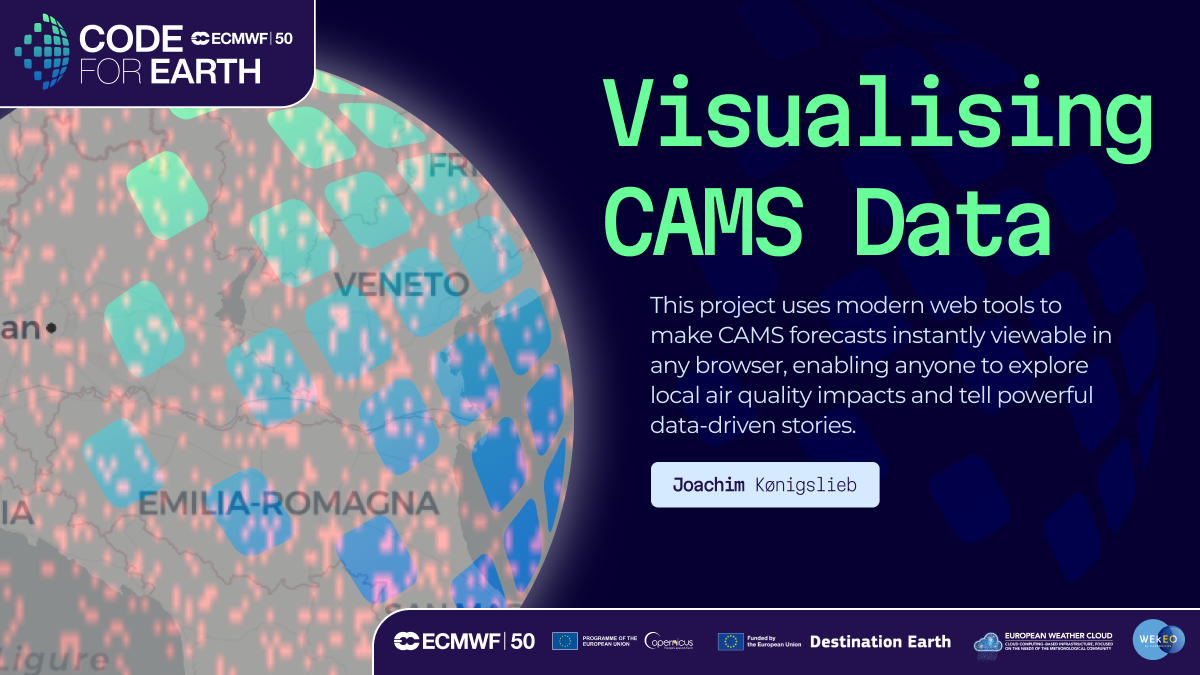
Visualizing CAMS data in the browser

Lots of data is sitting around on harddrives, sometimes being looked at by experts with the right toolset to vizualise it. Using modern web technologies we aim to visualize CAMS forecasts in the directly in the users browser in a highly interactive manner and with no barrier for entry: Just click a link!
Easily being able to look at these forecasts will enable us to tell powerful stories. You will be able to zoom in to your hometown and see the effects of a sandstorm or a nearby forest fire on your local air quality, or see methane hotspots and how these gas leaks diffuse throughout the atmosphere contributing to global warming.
Follow the developments on Github.
Mentors
- Miha Razinger
- Sebastian Steinig
Participants
Joachim Kønigslieb